CPI day 2 of the week
Trading notes for 2026-01-13
By Sean WeldonTL;DR
Traded CPI release day with markets at all-time highs, expecting the typical news-driven volatility to be largely irrelevant. Identified a liquidity grab opportunity when the market pushed lower after open, using standard deviation measurements to time a long entry back toward daily open, though we ultimately closed below the open for the first red day of the week.
Market Context
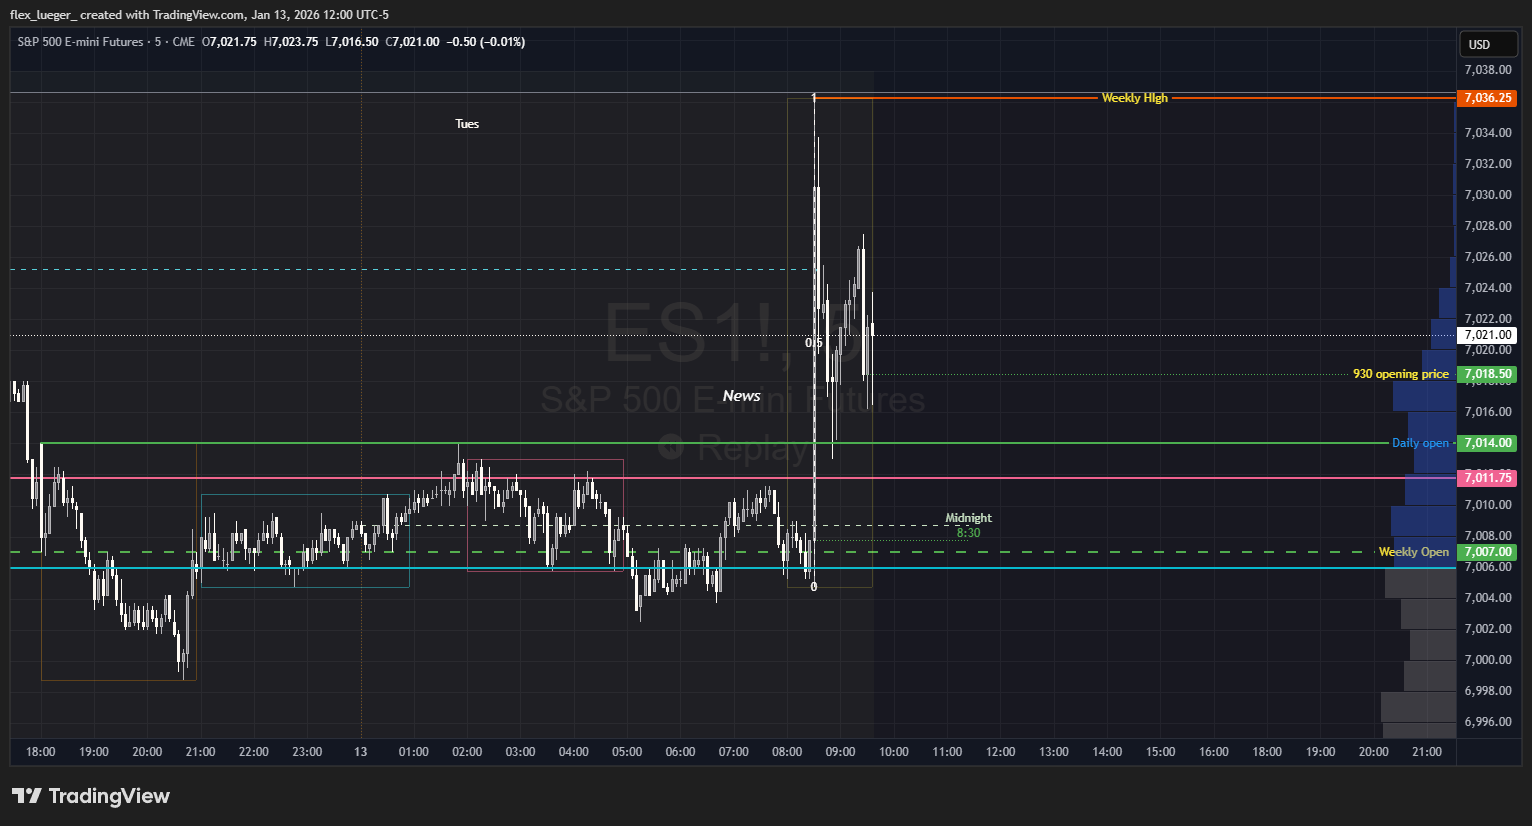
Today brought the monthly CPI release, one of those high-impact economic announcements that traders often overreact to despite the numbers typically being irrelevant to longer-term market direction. The market was already sitting at all-time highs heading into the 8:30 AM release, essentially walking a tightrope in that precarious zone where any news can trigger significant movement.
The setup had all the hallmarks of a news-driven volatility play rather than a fundamental shift in market sentiment.
Thesis & Plan
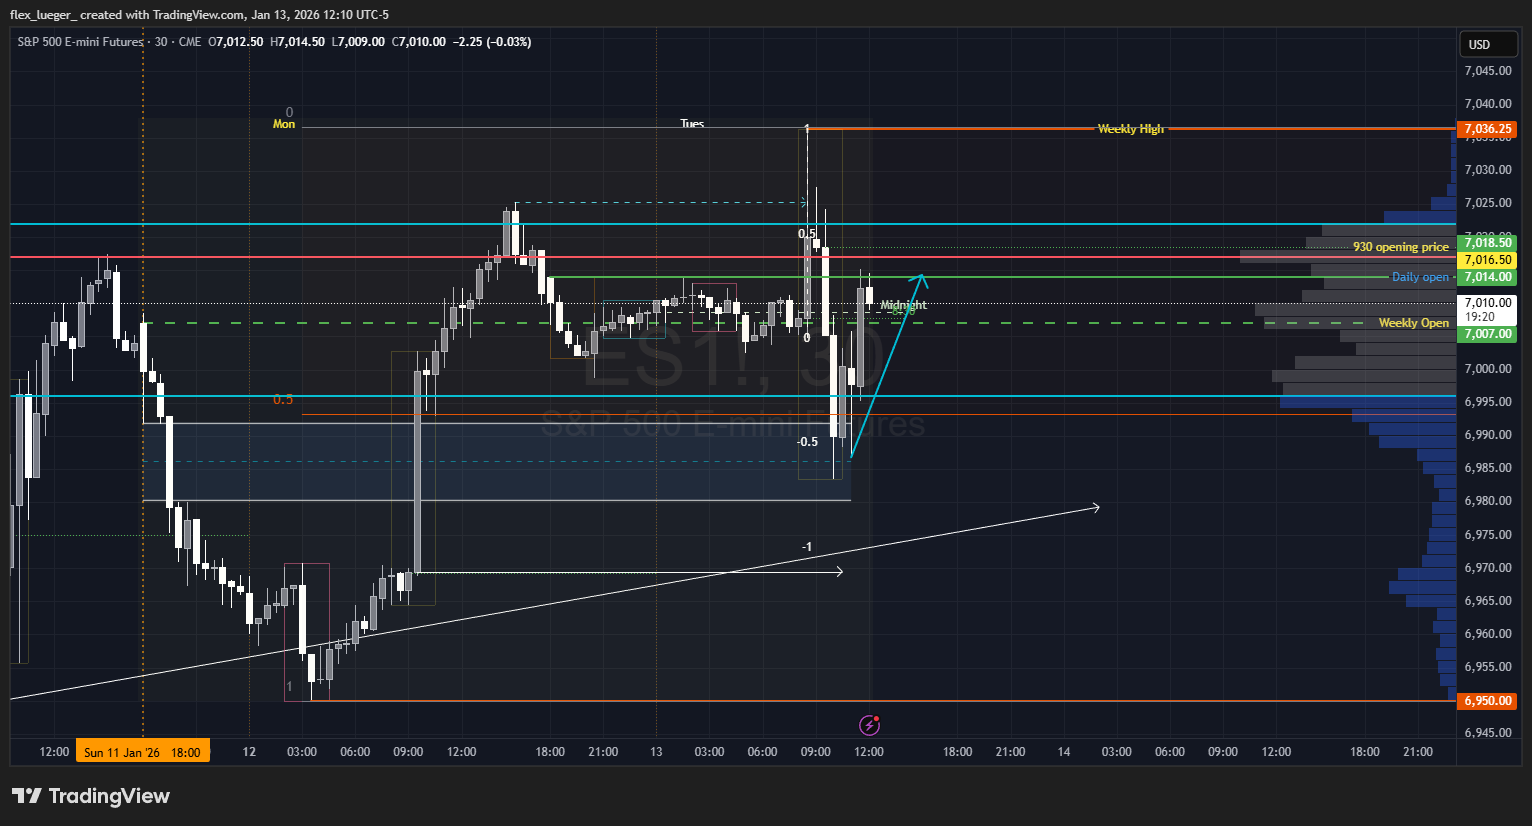
My thesis centered around the typical post-news manipulation pattern we see on CPI days. Markets often use the initial news reaction to create liquidity grabs before reverting to their underlying bias. Given we were at all-time highs with what appeared to be a favorable upward bias heading into the day, I was looking for the market to potentially shake out weak hands with a lower move before resuming higher.
The plan was to:
- Monitor the initial reaction post-CPI release
- Measure any downward manipulation move using standard deviation levels
- Look for support at logical technical levels combined with low-activity zones
- Enter long positions targeting a return to daily open levels
Entries & Exits
After the 9:30 AM open, the market delivered exactly the kind of one-sided manipulation move I was anticipating. Prices pushed lower in what appeared to be a coordinated effort to mitigate the previous day's gains, setting up for what looked like it could become a favorable up day.
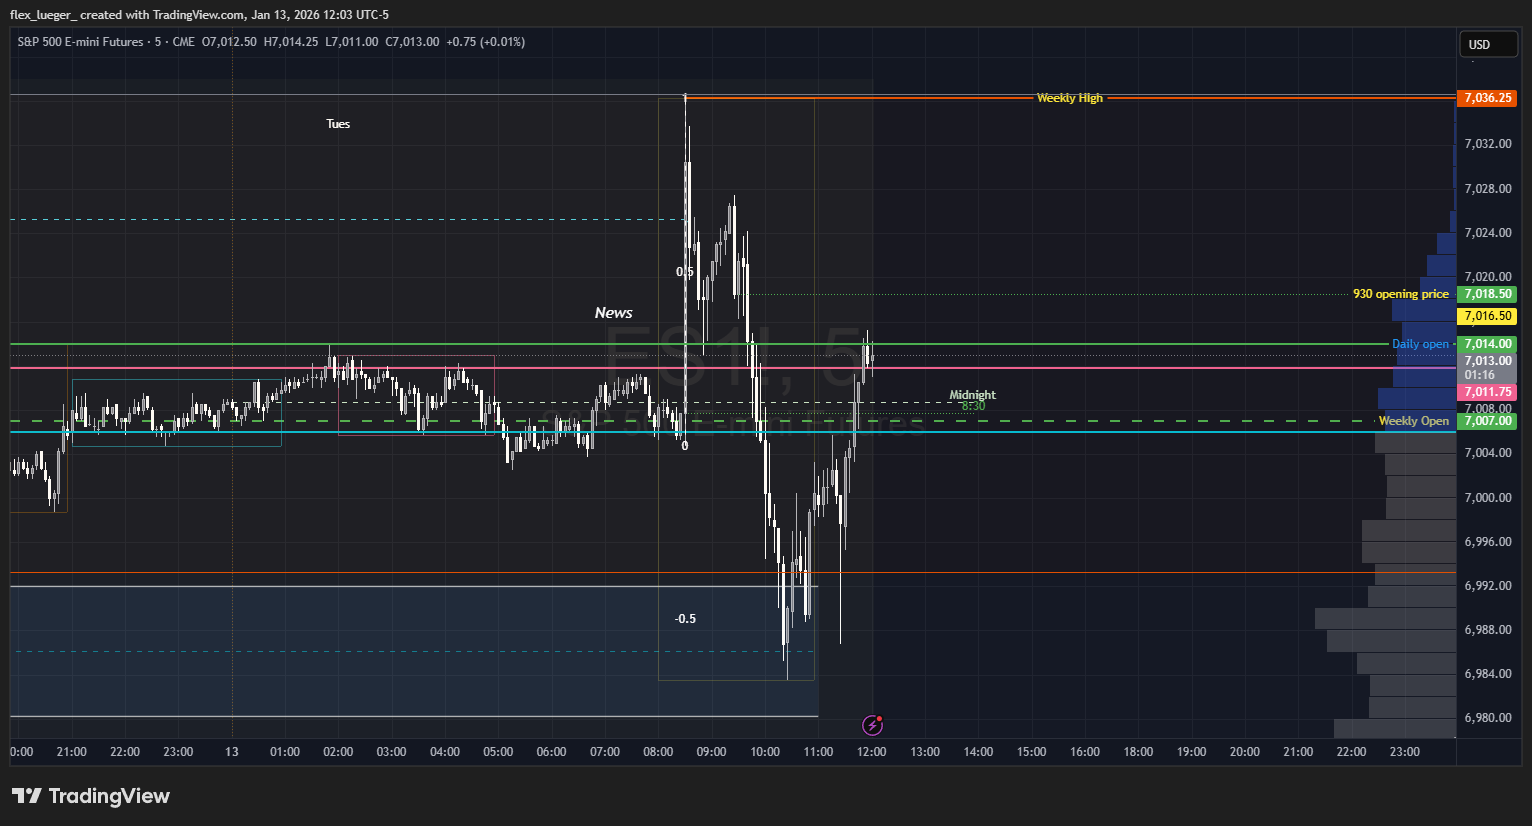
I measured the manipulation move carefully to gauge how deep this pullback might extend. The market pushed down to approximately the 0.5 standard deviation level, which aligned perfectly with a zone that had seen minimal previous activity and low volume on both the buy and sell sides.
This confluence of the 0.5 STDV level and the low-activity support zone provided an excellent risk-reward setup for a long position targeting the daily open.
Risk Management
My risk management approach relied heavily on standard deviation measurements to determine position sizing and stop placement. I use a clear hierarchy when evaluating market moves:
- 0.5 Standard Deviations: Typically just stop hunts or liquidity grabs, not measured moves
- 1-2 Standard Deviations: Usually indicate genuine measured moves with follow-through potential
Since this move measured right at the 0.5 STDV level, I treated it as a high-probability liquidity grab rather than the start of a larger directional move. This allowed me to be more aggressive with position sizing while keeping stops relatively tight below the confluence support zone.
What Worked / What Didn't
What Worked:
- The technical analysis was spot-on regarding the manipulation move depth
- The confluence of 0.5 STDV level and low-activity zone provided excellent support
- The standard deviation framework helped distinguish between stop hunts and measured moves
- Entry timing aligned well with the market finding support at the identified levels
What Didn't:
- Despite the solid technical setup, the broader market sentiment was weaker than anticipated
- The bounce back toward daily open lacked the conviction I expected
- Failed to account for the possibility that even a "liquidity grab" could mark the start of broader weakness
Lessons Learned
This trade reinforced several key principles while highlighting areas for improvement:
Confirmed Rules:
- CPI and similar news events often create more noise than signal
- Standard deviation measurements remain reliable for gauging move significance
- 0.5 STDV moves are typically short-term liquidity events rather than trend changes
- Low-activity zones continue to provide strong support/resistance levels
New Considerations:
- Even when technical levels hold perfectly, broader market context can override short-term bounces
- At all-time highs, markets may be more sensitive to any excuse for profit-taking
- "First red day" scenarios can carry more weight than typical technical bounces
The day ended below the daily open, marking the first red day of the week. While my technical analysis and entry were sound, this serves as a reminder that market context and sentiment can override even the most precise technical setups.
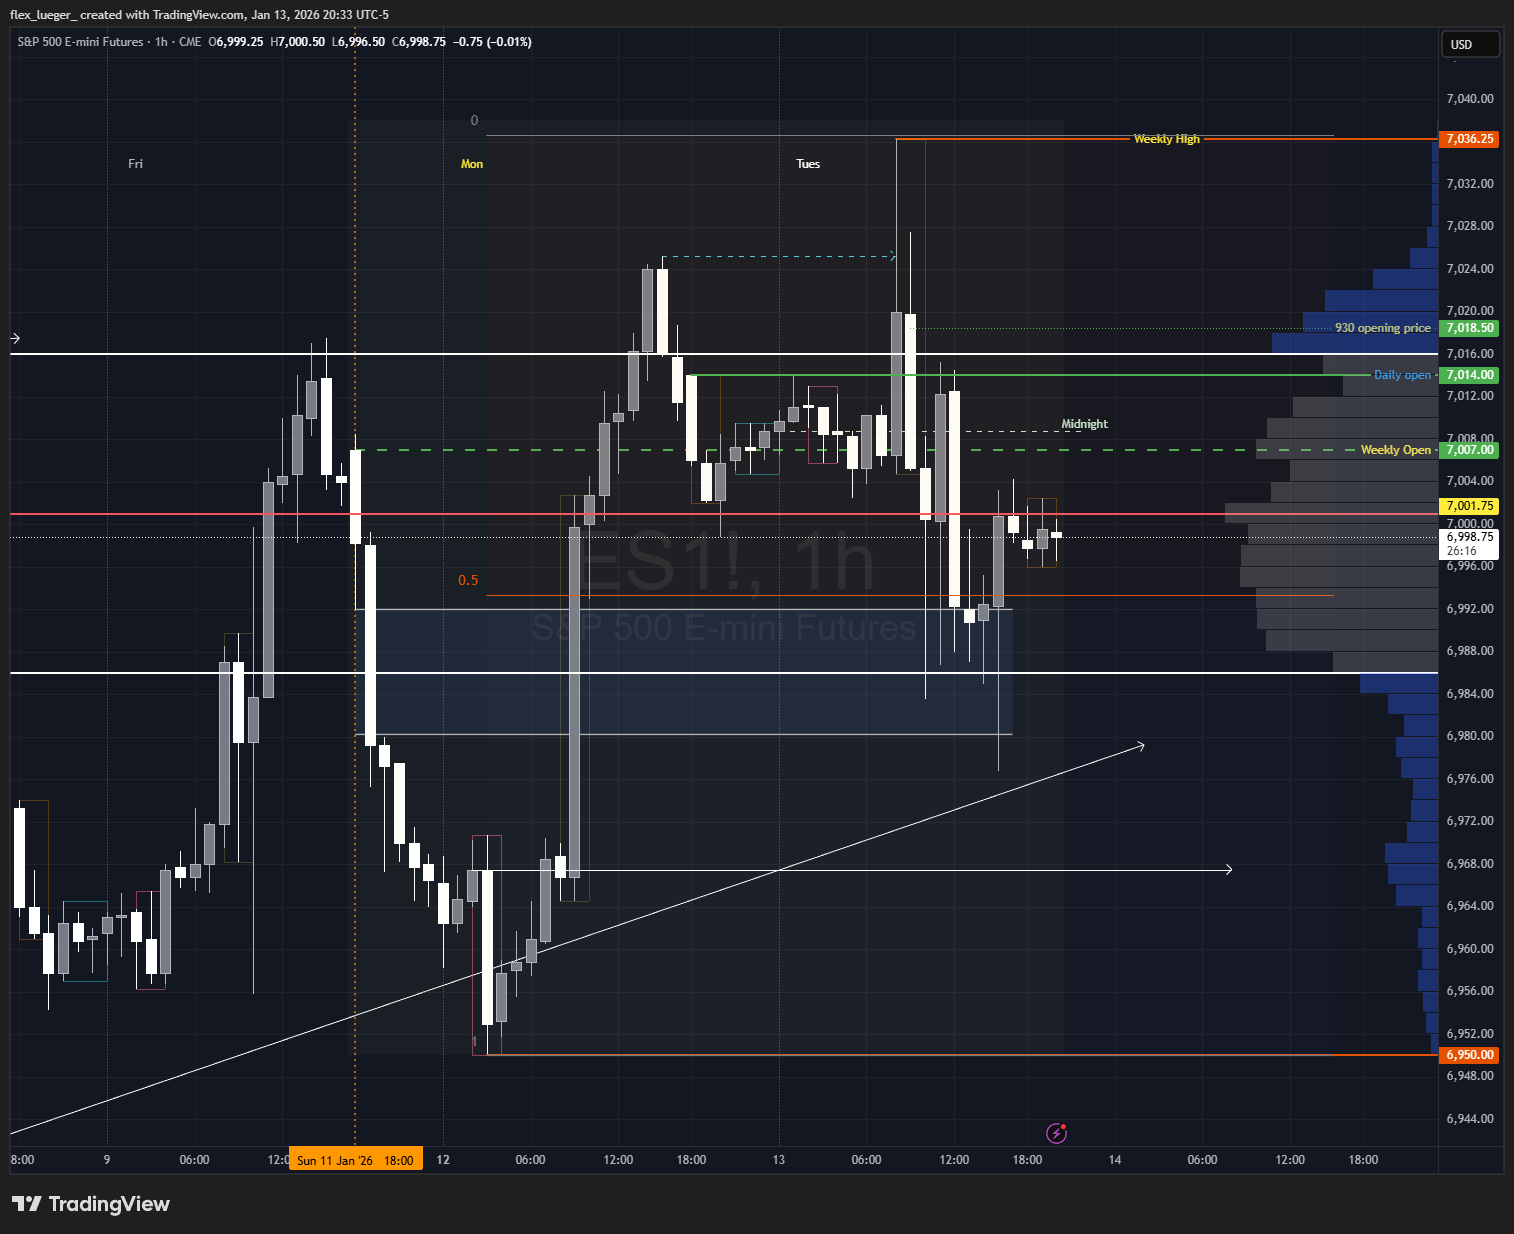
Moving forward, I'll continue to trust the standard deviation framework for measuring moves, but I need to give more weight to broader market positioning, especially when we're sitting at extremes like all-time highs. The technical tools worked exactly as expected, but the fundamental backdrop was more bearish than my analysis accounted for.