When the Structure Says No: Fading a Pre-Market Breakout on Delta Divergence
Trading notes for 2026-03-17
By Sean WeldonTL;DR — Pre-market ES took out weekly highs at 6,785 but the structure was wrong: buy-side imbalances only, red delta on the breakout candle, and CVD divergence at RTH open. Shorted 6,800, covered near VWAP at 6,770 after RTH low broke. The overnight rally was distribution, not continuation.
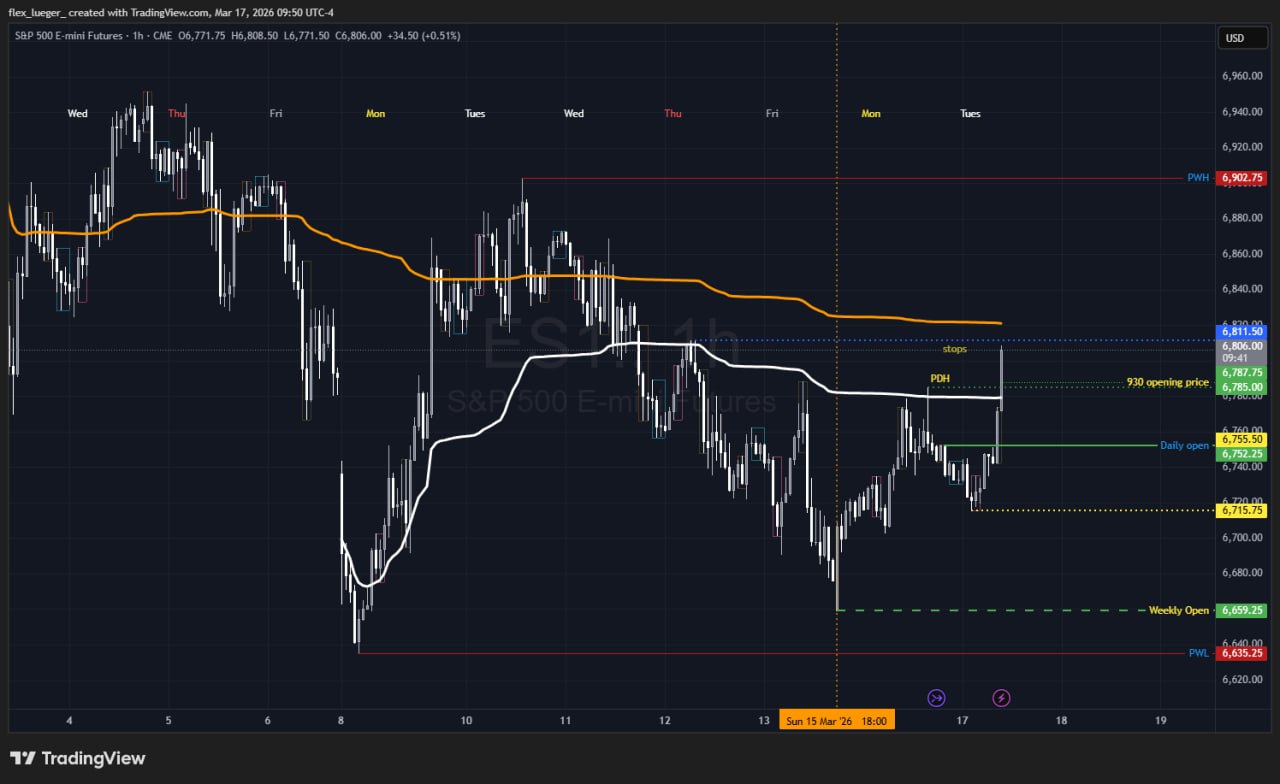
Market Context — ES had pulled back 120 points overnight from 6,785 to 6,665, holding just above the weekly open at 6,659. The recovery looked clean at first glance—value area had built at yesterday's highs, and price was testing back into that zone. Pre-market action pushed through the prior day high (6,785) and extended to 6,808, which on paper looked like textbook day 2 continuation. But the structure underneath told a different story.
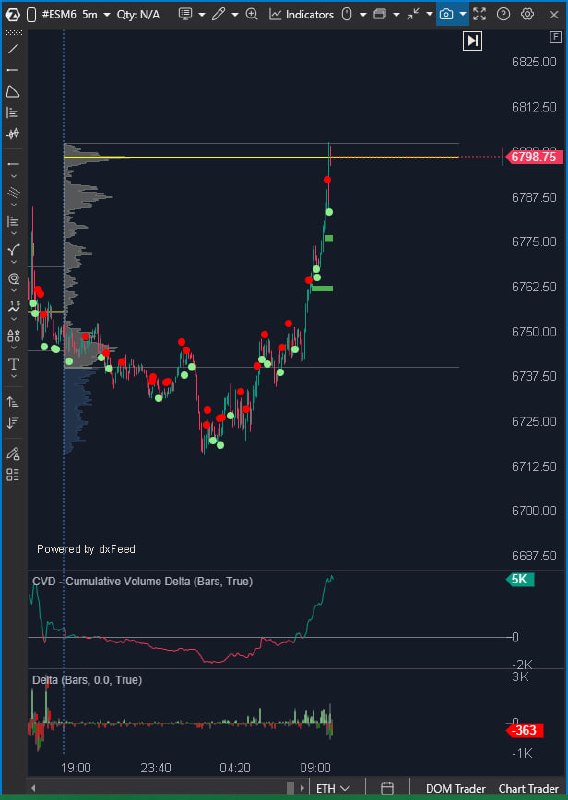
The overnight session showed a sharp rally from 6,720 to 6,808 with cumulative volume delta (CVD) climbing to +5K. Volume profile showed value migrating higher across sessions. Moving averages were aligned bullish, and price was well above the daily open at 6,752. Everything looked set up for continuation into RTH—except for the warning signs piling up under the surface.

Thesis & Plan — Initial read was cautiously bullish on day 2 continuation. The weekly high breakout should have confirmed the move if it held through RTH open. But several red flags emerged during pre-market analysis:
- The rally to 6,808 showed buy-side imbalances only—no sell-side absorption zones formed on the way up, meaning no fair value was established at lower prices.
- The specific candle that broke the weekly high had red delta—institutions were selling into the breakout, not buying it.
- Pre-market high takeout happened without balance building—price didn't consolidate at the highs, it just spiked and held.
- CVD peaked at +5K then started declining even as price stayed elevated near 6,800.
The thesis shifted from continuation to distribution. The plan became: wait for RTH open, watch for CVD divergence confirmation, and if the structure stayed weak, look to fade the breakout rather than follow it.
Entries & Exits — Shorted ES at 6,800 shortly after RTH open. The entry was based on:
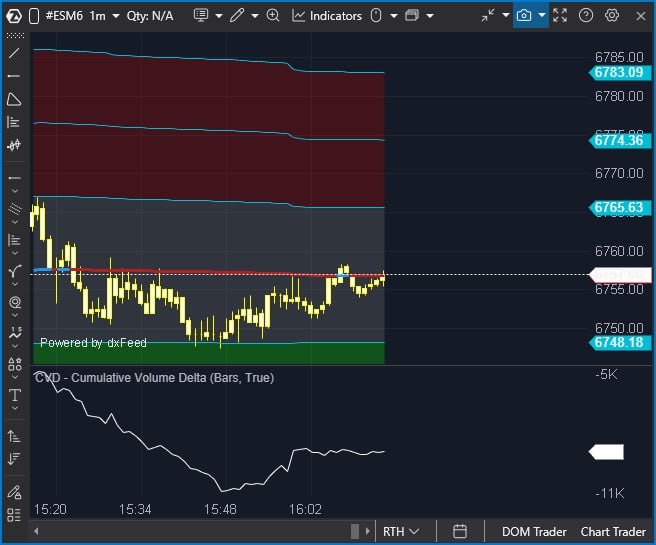
- CVD divergence confirmed: On the 1-minute RTH chart, price spiked from 6,788 to 6,816 at the open, but CVD made a lower high and started declining. Institutions were distributing into the open.
- Sell-side imbalances forming at highs: The 6,804-6,808 zone showed heavy selling pressure—not a balanced auction.
- Price stayed elevated while CVD dropped to zero: This created a structural gap. Price was at 6,800 but CVD had collapsed 7,000 points from its peak. The market was unbalanced.
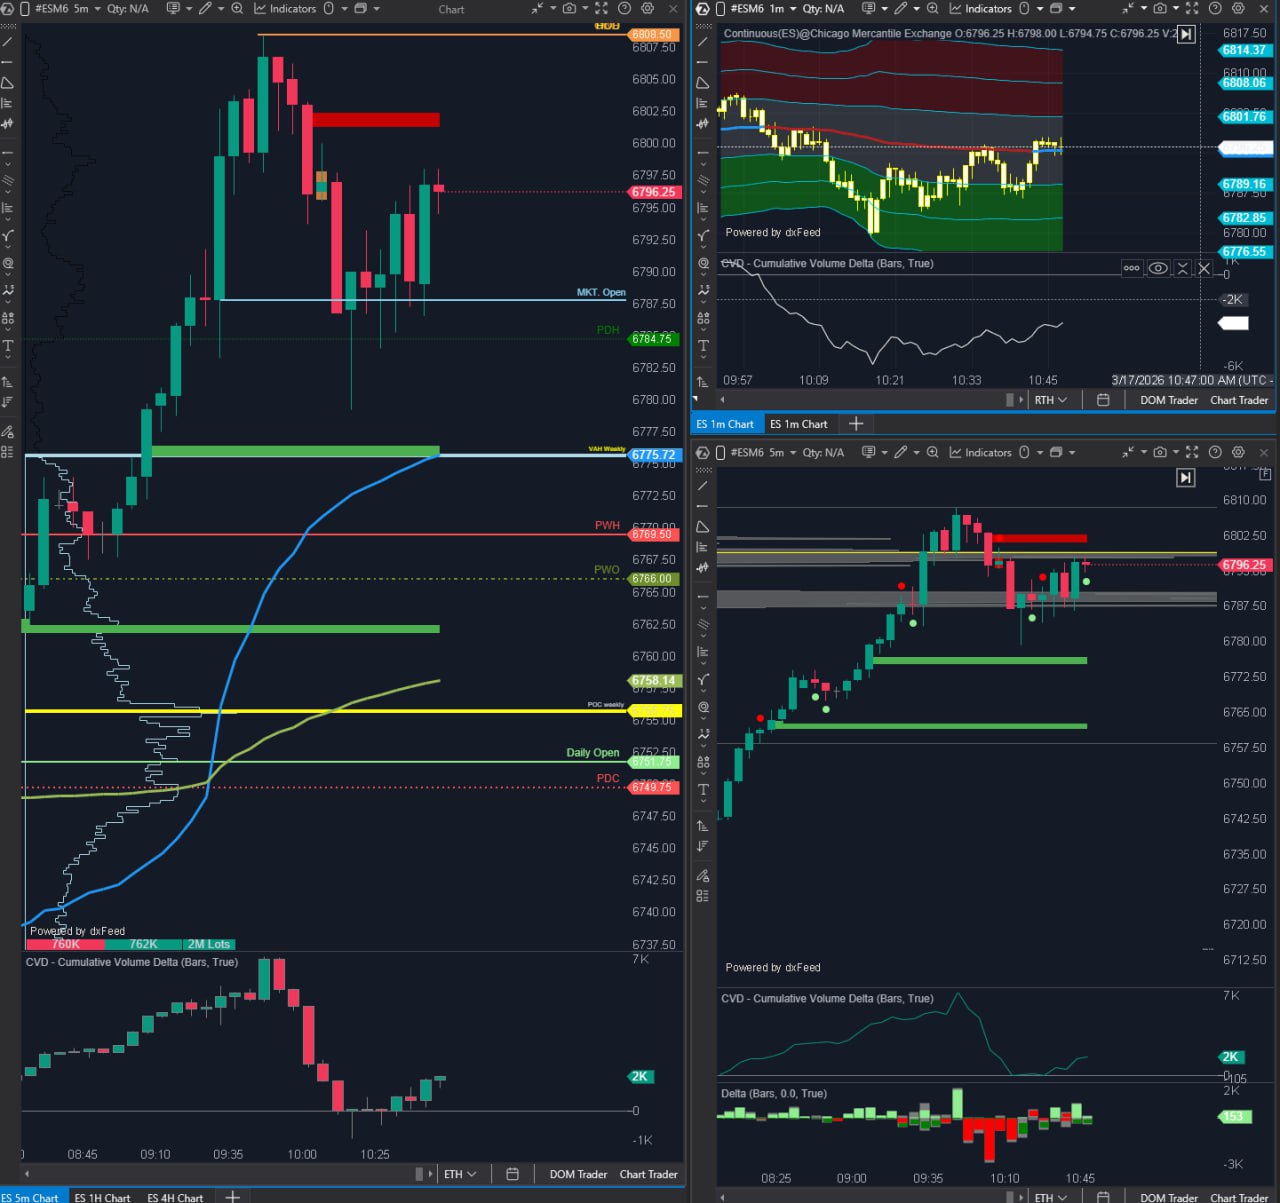
Entry at 6,800 with stop above 6,810 (above the 6,816 high). Target was daily VWAP around 6,770-6,775, where CVD had reached near-zero and where old consolidation zones (from earlier in the session) should provide support.
Price immediately started grinding lower after the short entry. It tested 6,780 (prior day high, now acting as support) and bounced briefly. The retest showed green delta, which created a moment of doubt—was this continuation reasserting itself? But price couldn't reclaim 6,800, and more importantly, CVD stayed weak. The bounce was short-covering, not real buying.
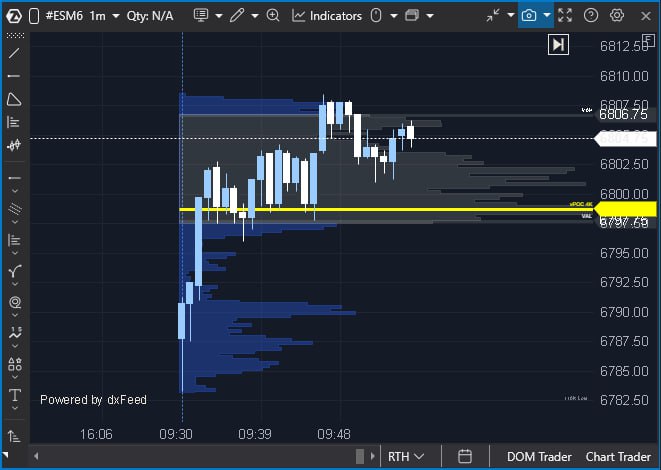
When price broke below the RTH low around 6,785, the thesis fully confirmed. Stops triggered below that level, and price accelerated toward VWAP. Covered the majority of the position at 6,775, near daily VWAP, where the CVD gap was filled and structure balanced out.
Risk Management — Stop was set tight at 6,810, just above the 6,816 RTH high. This kept risk to about 10 points. If price reclaimed 6,805 with volume and green delta, the distribution thesis would have failed and the stop would have triggered.
Partial profit was taken early (scaled out at 6,799) to lock in something if the trade reversed. The rest of the position was managed with a trailing stop—once price broke 6,785, stop was moved to breakeven at 6,800 to protect profit. This ensured the trade couldn't turn into a loss even if the market reversed hard.
Position sizing was moderate, not full size, because of the conflicting signals early on (CVD was still +5K cumulative, price structure was bullish on higher timeframes). The edge was there, but it wasn't overwhelming until the RTH low broke.
What Worked / What Didn't — What worked:
- Reading delta divergence across timeframes. The pre-market red delta on the breakout candle was the first clue. The RTH CVD divergence (price up, CVD down) sealed it. Trusting the delta over price action was the key.
- Understanding buy-side imbalances only = unsustainable structure. The lack of sell-side absorption on the rally meant there was no support underneath. When selling came in, there were no buyers to catch it.
- Waiting for RTH confirmation before committing. Pre-market moves fail often. Waiting until 9:30-9:50 AM to see if the breakout held saved me from chasing a bad setup.
- Targeting VWAP as the CVD gap fill. Price gravitates to where CVD reaches equilibrium. The 6,770-6,775 zone was the natural magnet.
What didn't work:
- Initial bias flip-flopping. I went from bullish (60/40) to neutral (50/50) to bearish (75/25) as new data came in. While being flexible is good, I second-guessed the early signals (red delta, buy-side imbalances) too much. The structure was already broken before RTH open—I should have been more confident in the bearish read earlier.
- Not adding size on the RTH low break. When price broke below 6,785, that was a high-conviction add signal. The thesis was fully confirmed at that point, but I didn't increase the position. Left money on the table.
Lessons Learned — 1. Red delta on a breakout candle = institutions are distributing. When price breaks a key level (weekly high, prior day high) but the candle shows net selling, it's a failed auction setup. The smart money is selling to the breakout chasers. This is a high-probability fade signal.
2. Buy-side imbalances only = structural weakness. A rally without sell-side absorption zones is unstable. It means no fair value was established on the way up. When selling pressure comes in, there's no support—just air pockets. This creates fast reversals.
3. CVD divergence at RTH open is a critical confirmation. Pre-market can be noisy, but if CVD peaks and starts declining while price stays elevated after RTH opens, that's institutions distributing into the liquidity. Trust the delta over the price.
4. VWAP is the natural target for CVD gap fills. When CVD drops to zero while price stays elevated, the market is unbalanced. Price will gravitate toward VWAP (where volume-weighted fair value sits) to rebalance. This is a reliable mechanical target.
5. Add size on confirmation, not on initial signal. The early signals (red delta, imbalances) gave the thesis. The RTH low break confirmed it. That's when conviction should go up and position size should increase. I need to be more aggressive on confirmations.